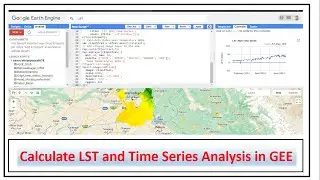
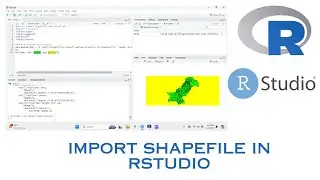
How to plot graphs using Excel csv data in R studio
Import data from excel into R. Then in R studio by ggplot2 we plot different type of graphs like line, point and bar charts.Importing data from excel into R is easy. Learn how to import data from excel by using both R code and by using the tools within R studio. This video is part of the R programming for beginners
ggplot2 is a system for declaratively creating graphics, based on The Grammar of Graphics. You provide the data, tell ggplot2 how to map variables to aesthetics, what graphical primitives to use, and it takes care of the details.
ggplot2 is now over 10 years old and is used by hundreds of thousands of people to make millions of plots. That means, by-and-large, ggplot2 itself changes relatively little. When we do make changes, they will be generally to add new functions or arguments rather than changing the behaviour of existing functions, and if we do make changes to existing behaviour we will do them for compelling reasons.
If you are new to ggplot2 you are better off starting with a systematic introduction, rather than trying to learn from reading individual documentation pages. Currently, there are three good places to start:
The Data Visualisation and Graphics for communication chapters in R for Data Science. R for Data Science is designed to give you a comprehensive introduction to the tidyverse..
If you want to dive into making common graphics as quickly as possible, I recommend The R Graphics Cookbook by Winston Chang. It provides a set of recipes to solve common graphics problems.
#rstudio
#csv_data
#ggplot2
#graphs
#chart