D3.js : Draw A Scatter Plot Using D3.js
https://www.udemy.com/course/d3js-dat...
D3.js in Action: Build 17 D3.js Data Visualization Projects
Find all our Udemy courses here:
https://www.udemy.com/user/cryptersin...
D3.js : Draw A Scatter Plot Using D3.js
A picture is worth a thousand words. In this video, you will find how to draw a scatterplot using D3.js. This shows the number of ice creams sold with respect to the day temperature.
Complete Family Tree using D3.js - Part 1
• Complete Family Tree - Part 1 (From U...
d3.js: Ancestry Chart using d3.js - Part 1
• d3.js: Ancestry Chart using d3.js - P...
d3.js: Stacked Area Chart using d3.js - Part 3
• d3.js: Stacked Area Chart using d3.js...
D3.js Data Joins: The Real Magic of D3
• D3.js Data Joins: The Real Magic of D3
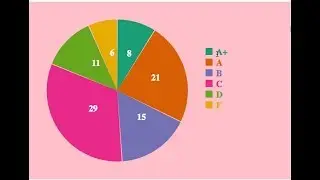
Pie Chart using D3.js (V5) - Part 2
• Pie Chart using D3.js (V5) - Part 2 (...