Pie Chart using D3.js (V5) - Part 1 (From D3.js Udemy Course)
https://www.udemy.com/course/d3js-dat...
D3.js in Action: Build D3.js Data Visualization Projects
Pie Chart using D3.js (V5) - Part 1
D3.js is a popular JavaScript library for manipulating documents in the context of data data. D3 stands for Data Driven Documents. D3 helps you bring data to life using HTML, SVG, and CSS.
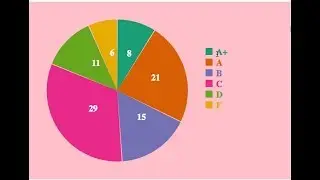
You could create pie charts in D3.js using arc generator function and pie generator function. This video explains how to display the student grade details using a pie chart.
https://www.udemy.com/course/d3js-dat...
D3.js in Action: Build D3.js Data Visualization Projects


![$1 Haircut VS $1000 Haircut [ASMR]](https://images.mixrolikus.cc/video/CDm9QPEAEKQ)