Debugging your code with DDT
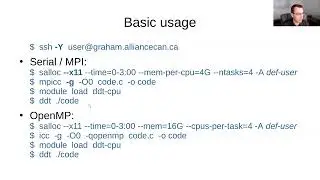
One of the important steps of developing or maintaining a code is debugging: checking the code for errors. Simple toy codes can be debugged using print statements, but realistic codes need specialized debugging tools. We have a powerful debugger "DDT" installed on Graham and Niagara clusters. This presentation will walk you through the steps required to start debugging your codes using DDT, and will present the main features of the software. It will cover a wide range of situations: from debugging serial codes (Python, C/C++, Fortran) to debugging parallel CPU codes (MPI, OpenMP) to debugging GPU codes (CUDA, ROCm/HIP) to debugging hybrid codes (combining MPI, CUDA etc.). No familiarity with DDT or debugging in general is required.
Previous webinars on this topic:
Debugging CUDA programs: • Debugging CUDA programs
Debugging OpenMP programs: • Debugging OpenMP programs
Debugging and profiling of MPI programs: • Debugging and profiling of MPI programs
_______________________________________________
This webinar was presented by Sergey Mashchenko (SHARCNET) on February 28th, 2024, as a part of a series of weekly Compute Ontario Colloquia. The webinar was hosted by SHARCNET. The colloquia cover different advanced research computing (ARC) and high performance computing (HPC) topics, are approximately 45 minutes in length, and are delivered by experts in the relevant fields. Further details can be found on this web page: https://www.computeontario.ca/trainin... . Recordings, slides, and other materials can be found here: https://helpwiki.sharcnet.ca/wiki/Onl...
SHARCNET is a consortium of 19 Canadian academic institutions who share a network of high performance computers (http://www.sharcnet.ca). SHARCNET is a part of Compute Ontario (http://computeontario.ca/) and Digital Research Alliance of Canada (https://alliancecan.ca).


![$1 Haircut VS $1000 Haircut [ASMR]](https://images.mixrolikus.cc/video/CDm9QPEAEKQ)