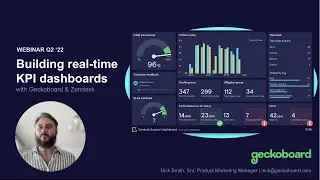
Geckoboard Speed Run: Building a Support Dashboard in Under 7 Minutes With Zendesk Support
See how easy it is to visualize live ticket data from Zendesk Support using Geckoboard, so your team can keep on top of key numbers and deliver an amazing support experience.
==========
Keeping your customer support agents aware of real-time metrics like CSAT, first response time and ticket volume can bring a new level of focus and motivation to your team. In this video, we show how easy it is to build up your own custom big-screen dashboard that raises the visibility of live Zendesk Support metrics, helping your team understand how they're performing at a glance.
Starting with a blank dashboard, we'll display unsolved tickets, tickets received this week, average time to close, CSAT, first response time and average time to close using easy-to-understand visualizations.
Finally, we'll add a leaderboard that lets individual agents understand how they're performing relative to everyone else in the team - a great way to inject some friendly competition, and a live feed of customer feedback.
All in under seven minutes.
For more information on how to visualize your own Zendesk Support metrics on a big screen, check out these links:
Geckoboard product overview: https://www.geckoboard.com/customer-s...
Geckoboard's Zendesk Support integration: https://www.geckoboard.com/product/da...
TV Dashboards: the ultimate guide: https://www.geckoboard.com/best-pract...
Dashboard design inspiration for Support teams: https://www.geckoboard.com/dashboard-...






![Stop creating Sales Dashboards in Excel – [Easy alternative]](https://images.mixrolikus.cc/video/hhu8i4s6yUg)
