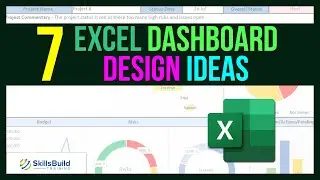
7 Excel Dashboard Design Ideas for Beautiful Reports
In this tutorial, I'll show you 7 Excel tips and tricks to make your dashboard beautiful, allowing you to explore the powerful tools that Excel has to offer.
Enjoy the Video!
00:22 Dashboard Designing
01:36 Tip 1: Select meaningful visual graphics for displaying data
01:50 Tip 2: Remove unwanted labels and headings
04:01 Tip 3: Arrange charts in an attractive way
04:14 Tip 4: Apply the timeline filter to Time Series Data
04:38 Tip 5: Select appropriate filters and slices to make it interactive for the user
05:21 Tip 6: Utilize the white area effectively
06:42 Tip 7: Select appropriate Color Scheme and Fonts
***Career Resources***
To get more of our best content on IT careers and IT certifications, go to
Be sure to leave any questions or comments below!
See More Videos and Subscribe: / @skillsbuildtraining
Website:
Facebook: / skillsbuildtraining
Twitter: / skillsbuildt






![Kali Linux vs BlackArch vs Parrot OS - Which is Best for [Ethical] Hacking?](https://images.mixrolikus.cc/video/l75r9tmdZic)

