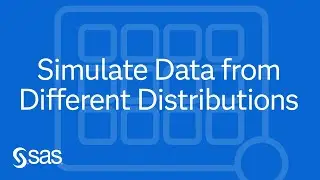
SAS Demo | Using SAS to Quickly Simulate Data from Different Distributions
In this SAS demo, Beth Ebersole of SAS demonstrates using SAS Studio on Viya to create and plot different probability density functions and simulate data from different distributions.
Beth Ebersole is a Principal Analytical Consultant with SAS. She has 30 years of experience in science and analytics, and a master's degree in biostatistics from the Johns Hopkins University in Baltimore, Maryland, USA. She develops and conducts machine learning, analytics, forecasting, and AI trainings at SAS.
Content Outline
00:00 – Use SAS to Quickly Simulate and Graph Data from Different Distributions
00:12 – Why Distributions are Important
01:09 – Common Distributions
01:16 – Normal (Gaussian) Distribution
01:55 – Negative Binomial Distribution
02:32 – Poisson Distribution
03:11 – Gamma Distribution
03:24 – Demonstration - Use SAS to Quickly Simulate and Graph Data from Different Distributions
Related Resources
◉ RAND Function SAS Documentation – https://go.documentation.sas.com/doc/...
◉ PDF BINOMIAL Distribution Functions SAS Documentation – https://go.documentation.sas.com/doc/...
SUBSCRIBE TO THE SAS USERS YOUTUBE CHANNEL #SASUsers #LearnSAS
https://www.youtube.com/SASUsers?sub_...
ABOUT SAS
SAS is a trusted analytics powerhouse for organizations seeking immediate value from their data. A deep bench of analytics solutions and broad industry knowledge keep our customers coming back and feeling confident. With SAS®, you can discover insights from your data and make sense of it all. Identify what’s working and fix what isn’t. Make more intelligent decisions. And drive relevant change.
CONNECT WITH SAS
SAS ► https://www.sas.com
SAS Customer Support ► https://support.sas.com
SAS Communities ► https://communities.sas.com
SAS Analytics Explorers ► https://explorers.sas.com
Facebook ► / sassoftware
Twitter ► / sassoftware
LinkedIn ► / sas
Blogs ► https://blogs.sas.com
RSS ► https://www.sas.com/rss


