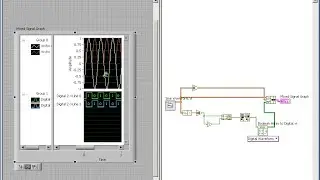
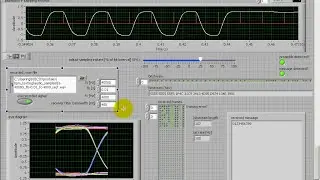
Simulation and visualization: Eye diagram metrics
Measuring noise margin, ISI, timing sensitivity, zero-crossing jitter, and optimum sampling time using an eye diagram. This video belongs to the "ISI and interactive eye diagram" page https://cnx.org/contents/KiOnofD4 in the "Communication Systems Projects with LabVIEW" resource at https://cnx.org/contents/4SUZIhwX.