39 Create Clustered Column Chart Power BI
Published on Dec 22, 2017:
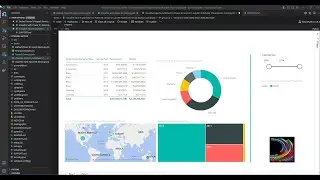
In this video, we will learn to create an alternative visualisation in Power BI if we have already got an existing visualisation.
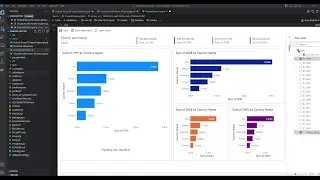
We will learn to convert a table to a clustered column chart.
In the previous video, we learnt to calculate totals for previous year. We can use the previous years totals for display or comparison purposes.
Previous Video: • 37 Create a Table Power BI
You can download the power bi file used from the below location.
https://goo.gl/KPdcdX
File name for the file is - 39. Creating Clustered Column Chart Power BI
SUBSCRIBE to learn more about Power BI,Power Query, Power Pivot, Excel,SQL Server and Python!!
/ @learnexcelrelentless
Our Playists:
SQL Playlist :https://goo.gl/PS5Ep6
DAX PlayList : https://goo.gl/S4W41D
Power BI PlayList: https://goo.gl/dXxvnB
Power Query Playlist: https://goo.gl/5QS7P4
Getting Started with Power BI:https://goo.gl/GHakLZ
Getting Started with Python: https://goo.gl/n24P3w
ABOUT DAGDOO:
Website:
Home Page: http://www.dagdoo.org/
Power BI Tutorials: http://www.dagdoo.org/excel-learning/...
Questions? Comments and SUGESTIONS? You will find me here:
Twitter: @dagdooe
Category: Science & Technology
License: Standard YouTube License