Student Registration Process Flow Diagram In Visio
Use this video tutorial you will learn how to draw Student Registration Process flowchart diagrams using Microsoft Visio. SUBSCRIBE!!! http://howtoanalyzedata.net/youtube
-- Download Sample Visio Diagrams [.VSDX Files] to follow along and Jump Start Your Own Diagram (E-Commerse Shopping Process, Basic Flowchart, Org chart, Agile Release Process, Salesforce Release Process, Swimlane Diagram, Simple Rectangular Room and More): https://www.howtoanalyzedata.net/dq5e
____
LETS CONNECT:
Subscribe on YouTube: https://www.howtoanalyzedata.net/youtube
Join Facebook Community (Facebook Page): https://www.howtoanalyzedata.net/face...
Connect on LinkedIn: https://www.howtoanalyzedata.net/link...
Instagram: https://www.howtoanalyzedata.net/inst...
Subscribe to Email: https://www.howtoanalyzedata.net/email
#visio #swimlane #diagram #VisioTutorial #VisioDiagrams #MicrosoftVisio
If appropriate for your needs, Visio can produce extremely helpful, slick, useful diagrams of all types, and these can provide the professional look you want for presentations, reports, audits, building plans, floor plans, documentation, and modeling better ways to do things. Visio includes a big library of shapes/symbols used in dozens of diagram types. These symbols represent specialized pieces of diagrams such as process flow diagrams, business process modeling, data flow diagrams, and many more. These are used widely in various fields for various purposes.
In today’s organizations with multiple work groups or departments, this diagramming can help in various ways:
It can help to ensure that the right hand knows what the left is doing in an organization. Swimlane Diagrams, and swimlanes used in other diagram types, highlight which process steps or sub-processes are assigned to a particular actor in the organization.
By spelling this out in a diagram, you can highlight redundancies between different lanes and identify bottlenecks, waste and other inefficiencies. This sometimes reveals duplicative or unnecessary steps in a process, such as different departments performing the same task. It also can highlight process delays or capacity constraints within a particular swimlane so that they can be addressed and resolved. This can increase performance and quality and reduce unnecessary work and costs.
You can use a second Swimlane Diagram to model a better way to structure the process or to account for changing circumstances, such as staffing changes or technology changes.
Like other diagrams, Swimlane Diagrams can communicate in clearer terms than a narrative description would.
Swimlane Diagrams can be formalized as a way to integrate processes between teams or departments, resulting in cleaner processes on an ongoing basis.
____
LETS CONNECT:
Subscribe on YouTube: https://www.howtoanalyzedata.net/youtube
Join Facebook Community (Facebook Page): https://www.howtoanalyzedata.net/face...
Connect on LinkedIn: https://www.howtoanalyzedata.net/link...
Instagram: https://www.howtoanalyzedata.net/inst...
Subscribe to Email: https://www.howtoanalyzedata.net/email
#visio #swimlane #diagram #VisioTutorial #VisioDiagrams #MicrosoftVisio


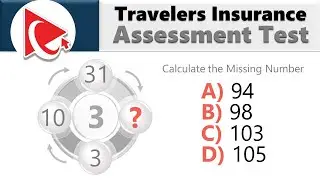
How to Pass Traveler's Insurance Pre-Employment Assessment Test: The Comprehensive Guide!
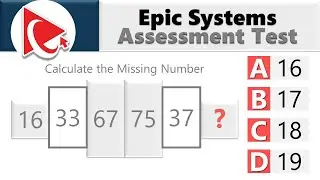
How to Pass the Epic Systems Pre-Employment Assessment: The Ultimate Practice Test Guide!