Prometheus, Alert Manager, Email Notification & Grafana in Kubernetes Monitoring | Merciboi
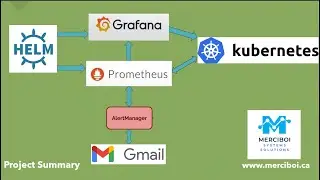
This video demonstration covers the installation of Prometheus and Grafana using Helm, for the purpose of monitoring the kubernetes cluster and applications, and visualization of real time data onthe Grafana dashboards.
It also covers the configuration of email (GMail) alerting through the alert manager, and the configuration of the Prometheus Server and Grafana User Interface.
Kubernetes cluster monitoring and application uptime are very vital to the DevOps Automation Process.
Resources:
https://github.com/DinmaMerciBoi/Prom...
Connect with me:
Merciboi Systems Solutions,
Canada
Websites: www.merciboi.com, www.merciboi.ca
LinkedIn: www.linkedin.com/in/dinmamerciboi
GitHub: https://github.com/DinmaMerciBoi
Facebook: / merciboisystemssolutions
Email Addresses: [email protected], [email protected]
Register for our six-month Intensive Online DevOps Masterclass - highly flexible and personalized. For details, visit www.merciboi.com/training, or email us at [email protected].
To register, email us at [email protected]
#prometheus #grafana #alertmanager #emailalerting #helm #helmcharts #grafanadashboards #emailnotificationkubernetes #kubernetes #kubernetestutorialforbeginners #kubernetesmonitoring #clustermonitoring #k8s #gmailalertingkubernetes #devops #devopstutorialsforbeginners #sitereliabilityengineering #devopsmasterprogram #devopsmonitoring #kubernetesadministration #devopsproject #devopstrainingvideos #devopsmerciboi #merciboi #minikube #minikubemonitoring #kubernetesproduction