Create a ViolinPlot in Power BI
Published on Aug 28, 2020:
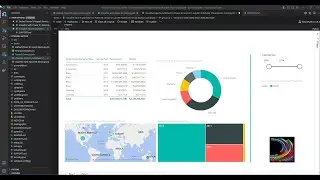
In this video, we will learn to create a violinplot using the python visual in Power BI Desktop.
In the previous video, we learnt to create a jointplot using the python visual in Power BI Desktop.
Previous Video: • Create a JointPlot Python visual Powe...
You can download the file from:
https://bit.ly/2QraYix
File Name: Create a ViolinPlot Power BI.pbix
Video to set up python scripting:
• Run Python Script in Power BI Desktop
Link to Power BI Community mentioned in the video:
https://bit.ly/3248trU
Link to winpython install download
https://bit.ly/349aRAq
SUBSCRIBE to learn more about Power BI,Power Query, Power Pivot, Excel,SQL Server and Python!!
/ @learnexcelrelentless
Our Playists:
Python and Power BI:https://bit.ly/2EajdNc
Getting Started with AWS: https://bit.ly/2PgSCQX
SQL Playlist :https://goo.gl/PS5Ep6
DAX PlayList : https://goo.gl/S4W41D
Power BI PlayList: https://goo.gl/dXxvnB
Power Query Playlist: https://goo.gl/5QS7P4
Getting Started with Power BI:https://goo.gl/GHakLZ
Getting Started with Python: https://goo.gl/n24P3w
Data Science With Python:https://goo.gl/PeYCR5
Power BI service: http://tiny.cc/sjekmz
ABOUT DAGDOO:
Website:
Home Page: http://www.dagdoo.org/
Power BI Tutorials: http://www.dagdoo.org/excel-learning/...
Questions? Comments and SUGESTIONS? You will find me here:
Twitter: @dagdooe
Category: Science & Technology
License: Standard YouTube License


