#0 Course Introduction Matplotlib | Matplotlib tutorial 2021
📚 Full course Link: http://bit.ly/UdemyDaViz
➿ Course Introduction video for Comprehensive data visualization with Matplotlib in Python.
🌐 Website: https://www.aipython.in/matplotlib for 🖺documentation and 🔡code
🔗 Useful links related to this video: https://matplotlib.org/
🎦 Current Playlist [Matplotlib in Python] Videos
#0 Course Introduction • #0 Course Introduction Matplotlib | M...
#1 Course Curriculum • #1 Course Curriculum Data visualizati...
#2 Introduction to Matplotlib for Data visualization in Python • #2 Introduction to Matplotlib for Dat...
#3 Installing Matplotlib with dependencies in Python • #3 Installing Matplotlib with depende...
#4 Getting started with Jupyter notebook • #4 Getting started with Jupyter noteb...
#5 Introduction to Pyplot • #5 Introduction to Pyplot | Matplotli...
#6 Adding labels and formatting line style • #6 Adding labels and formatting line ...
#7 Specify manual axis and customize markers in a plot • #7 Specify manual axis and customize ...
#8 Applying Title and legends in a plot • #8 Applying Title and legends in a pl...
#9 Creating Scatter plots in Python • #9 Creating Scatter plots in Python |...
#10 Interacting with the plot in Python • #10 Interacting with the plot in Pyth...
#11 Plot a Histogram in Python • #11 Plot a Histogram in Python | Matp...
#12 Plot a Pie chart in Python • #12 Plot a Pie chart in Python | Matp...
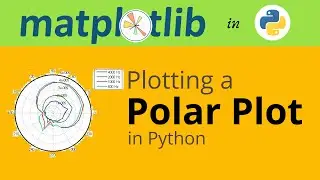
#13 Polar plot in Python • #13 Polar plot in Python | Non-linear...
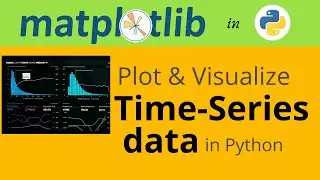
#14 Time series visualization python • #14 Time series data visualization in...
#15 Saving matplotlib plot as pdf or png • #15 Saving matplotlib plot as pdf or ...
🎦 aipython's Playlist link
Python Tutorial for Beginners: https://bit.ly/3bAubXP
Python Tips & Tricks: https://bit.ly/2JpVND4
Python Projects: https://bit.ly/2UHAbY1
Matplotlib in Python: https://bit.ly/ai-matplotlib
🤝 Connect and follow us @
Website : https://www.aipython.in
facebook (Page) : / aipythonindia
Facebook (Group): / aipython
Instagram: / aipython_india
Twitter : / aipython_india
LinkedIn : / aipythonindia
#course #matplotlib #datavisualization