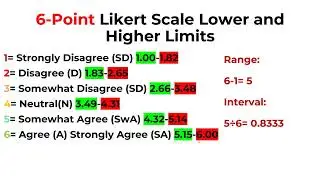
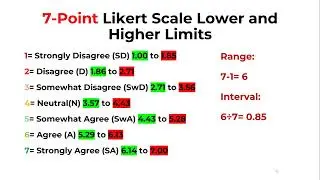
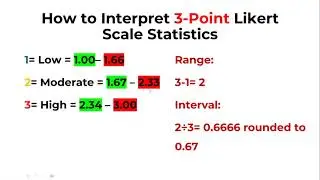
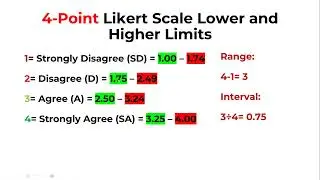
Likert scale analysis
How to analyze Likert scale and interpret the results fast
Dr. Benhima demonstrates how to analyze Likert scale survey on SPSS and report the results.
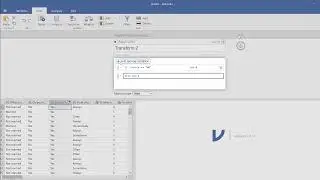
Frequency, percentage, mean, standard deviation are put in one table on SPSS.
The user needs to check the coding of the Likert scale and make sure the measure is set as ordinal or nominal (SPSS deals with that automatically). Custom table
Subtable %
Mean nnn 2 decimals
Standard deviations nnn 2 decimals
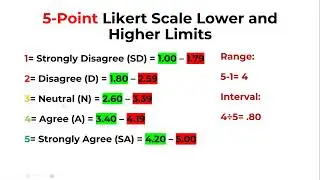
The order can be ascending or descending depending on the way Likert scale is coded 1 strongly disagree and 5 strongly agree.
Total can be renamed as: Descriptive statistics (DS)
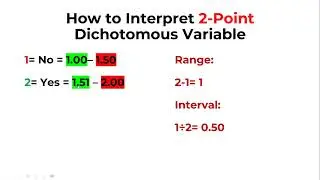
Categorical measurement level
Ordinal measurement level
Likert scale data analysis and interpretation
SPSS
Excel
📌 For assistance with data analysis, kindly contact me via this email: [email protected] or WhatsApp: +212619398603 / wa.link/l6jvny / https://t.me/DrBenhima
Facebook: / benhima1
https://www.facebook.com/profile.php?...
Instagram: / medbenhima2015
LinkedIn: / mohamed-benhima-phd-6a1087109
TikTok: https://www.tiktok.com/@mohamedbenhim...
Google Scholar: https://scholar.google.com/citations?...
Researchgate: https://www.researchgate.net/profile/...
Twitter: / mohamed_benhima
Snapchat: https://www.snapchat.com/add/benhima0...
🟨 Get a Research Model Template for Research Proposals using Surveys! 📊🔬
👉📄✏: ✔Likert scale questionnaire design, validation, and analysis based on the Literature: TAM, UTAUT and other models https://redev.gumroad.com/l/ifltp
✔ AI Detector Pro for AI Removal: 💡👉🏻 https://aidetector.pro/?aff=20483
✔ ChatGPT 4 subscription: https://forms.gle/N9rnX6Q9w4dWWDAo9
✔ Coupon code for Typeset and Scispace: 40% discount on the annual plan coupon code: Ben24 https://typeset.io/pricing
✨Social media:
Email: [email protected]
WhatsApp: +212619398603 / wa.link/l6jvny
![[FREE] -MEDU$A- Trap type beat | Ramybeats](https://images.mixrolikus.cc/video/cA6R8ZA0Vt8)


