#5 Introduction to Pyplot | Matplotlib tutorial 2021
📚 Full course Link: http://bit.ly/UdemyDaViz
➿ You will learn about the pyplot in this section. Pyplot is a part of the matplotlib library, focused on creating plots. Pyplot is actually the collection of several functions each targeting a specific component. The functionalities of pyplot are inspired from MATLAB, so in case if you don't know, MATLAB is one of the best mathematical computing tools out there in the industry, in fact, the full form of MATLAB is MATrix-LABoratory. Each pyplot function makes some changes to figure for plot such as creating a figure itself, creating a plot area, adding data and so on. In this module, you will learn various properties associated with pyplot and how to play with those properties.
🌐 Website: https://www.aipython.in/matplotlib for 🖺documentation and 🔡code
🔗 Useful links related to this video: https://matplotlib.org/
🎦 Current Playlist [Matplotlib in Python] Videos
#0 Course Introduction • #0 Course Introduction Matplotlib | M...
#1 Course Curriculum • #1 Course Curriculum Data visualizati...
#2 Introduction to Matplotlib for Data visualization in Python • #2 Introduction to Matplotlib for Dat...
#3 Installing Matplotlib with dependencies in Python • #3 Installing Matplotlib with depende...
#4 Getting started with Jupyter notebook • #4 Getting started with Jupyter noteb...
#5 Introduction to Pyplot • #5 Introduction to Pyplot | Matplotli...
#6 Adding labels and formatting line style • #6 Adding labels and formatting line ...
#7 Specify manual axis and customize markers in a plot • #7 Specify manual axis and customize ...
#8 Applying Title and legends in a plot • #8 Applying Title and legends in a pl...
#9 Creating Scatter plots in Python • #9 Creating Scatter plots in Python |...
#10 Interacting with the plot in Python • #10 Interacting with the plot in Pyth...
#11 Plot a Histogram in Python • #11 Plot a Histogram in Python | Matp...
#12 Plot a Pie chart in Python • #12 Plot a Pie chart in Python | Matp...
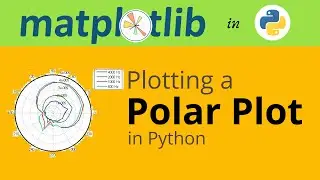
#13 Polar plot in Python • #13 Polar plot in Python | Non-linear...
#14 Time series visualization python • #14 Time series data visualization in...
#15 Saving matplotlib plot as pdf or png • #15 Saving matplotlib plot as pdf or ...
🎦 aipython's Playlist link
Python Tutorial for Beginners : https://bit.ly/3bAubXP
Python Tips & Tricks : https://bit.ly/2JpVND4
Python Projects : https://bit.ly/2UHAbY1
Matplotlib in Python : https://bit.ly/ai-matplotlib
🤝 Connect and follow us @
Website : https://www.aipython.in
Facebook (Page) : / aipythonindia
Facebook (Group): / aipython
Instagram : / aipython_india
Twitter : / aipython_india
LinkedIn : / aipythonindia
#pyplot #matplotlib #aipython