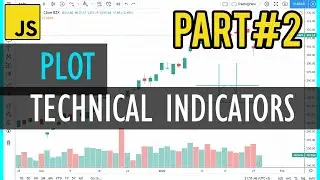
Plot Indicators using Tradingview Charting Library - Javascript, NodeJS
#tradingview
#technicalindicators
#javascript
#charting
Previous video: • Plot Indicators using Tradingview Cha...
Code: https://github.com/karthik947/PlotInd...
How to plot TV Chart with own data using API: • Plot TradingView Charts with Own Data
How to plot TV Chart using local CSV file data : • Plot Tradingview Chart using CSV file...
How to plot Indicators: • Plot Indicators using Tradingview Cha...
tulip indicators: https://tulipindicators.org/
npm tulind: https://www.npmjs.com/package/tulind
npm nodemon: https://www.npmjs.com/package/nodemon
All TV Libraries: https://in.tradingview.com/HTML5-stoc...
LW Library: https://in.tradingview.com/lightweigh...
LW Doc: https://github.com/tradingview/lightw...
LW Doc ReadMe: https://github.com/tradingview/lightw...
Disclaimer:
I am not a financial advisor nor is any content in this article presented as financial advice. The information provided in this post or any other posts that I make and any accompanying material is for educational purposes only. It should not be considered financial or investment advice of any kind. Use these tools at your own risk.
Email me at [email protected]